Commodities had a mixed week with currencies and equities providing little guidance. In Europe the economic outlook continues to improve while the showdown with Athens carries on with most expecting that a solution will be found.
China and other big Asian economies are on holiday celebrating Lunar New Year and this triggered a slowdown in activity which left some markets more vulnerable than others, especially industrial and precious metals.
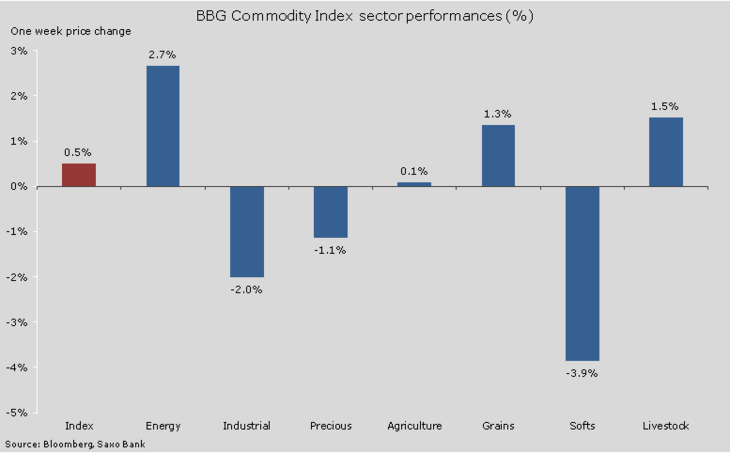
Figure 01: sector performances
The energy sector was supported by natural gas as cold weather in the US boosted demand for heating, while both crude oils traded sideways for a third consecutive week.
Forward-looking indicators such as the continued slump in US oil rig counts combined with supply disruptions from Libya and Iraq provided the support, while backward-looking production data once again painted a picture of a very oversupplied market, with US supply and production rising to a multi-decade high.
Precious metals have been exposed to continued long liquidation from traders following the recent slump below technical support levels. Rising US government bond yields are a current drag on the market while a less hawkish statement from the latest FOMC meeting helped settle a few nerves.
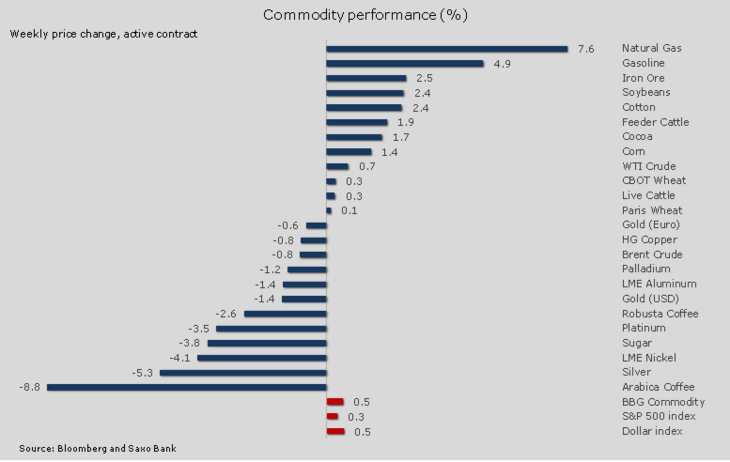
Figure 02: Individual commodity performance
USDA gives the bean a boost
The grain market, which for the past couple of months has had to settle for guidance through export data, crop developments in South America and currency movements, received the first indication of what and how much US farmers intend to plant during the coming months of spring.
The report from the US Department of Agriculture surprised the market as it lowered the expected acreage for soybeans which subsequently gave the bean a boost.
Lower prices during the past year for all three major crops combined with the reduced competitiveness due to a rising dollar makes for some difficult decisions for US farmers. Adding to this, the soon-to-arrive bumper crop from South America means the near-term outlook for higher prices across the sector seems limited.
Crude oil range-bound being torn between forward- and backward-looking data
Crude oil has been settling into a range during the past few weeks with Brent crude having a slight edge over WTI crude due to international developments. Trading conditions remain difficult with traders being pushed around with the alternating focus between forward- and backward-looking data.
US inventories and production continue to rise despite the one-third reduction in oil rig counts since last October. Last week saw US inventories expand to a record of 425.6 million barrels while production rose to 9.28 mn barrels a day, which is the highest since the EIA began compiling such date in 1983.
Positive storage economics – where traders buy cheap crude oil in the spot market and place it in storage and simultaneously sell in the future at a higher price – has helped trigger a dramatic rise in inventories at Cushing. Since October inventories have more than doubled to 46.3 mn barrels, not far from the record 51.9 mn barrels reached two years ago.
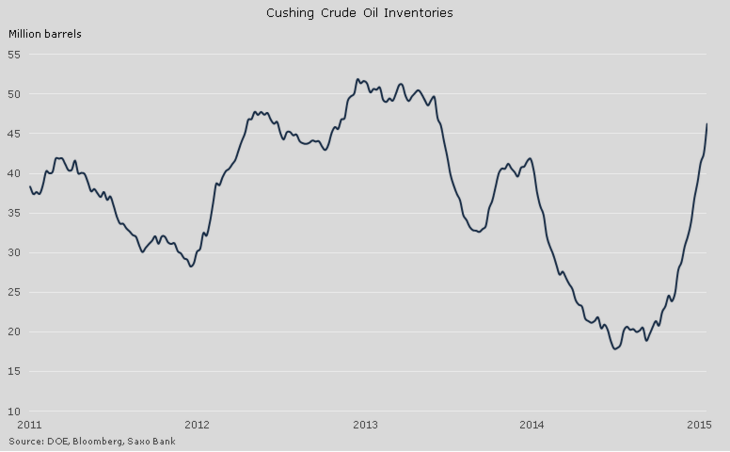
Figure 03: Cushing crude oil inventories
This leaves the burning question: will Cushing will run out capacity before production begins to slow? If it does it carries the potential consequence of sending spot crude back towards new lows.
Goldman Sachs, for one, believes this a current risk and it maintains a target of $39 per barrel on WTI crude oil during the coming months. Whether this is the reason or not we have recently seen much attention in the option market to the $40/b Put strikes, with expiry in April and June being the two most actively options traded during the past week.
Support to oil prices has come from several sources this week. Apart from the continued fall in US rig count, EOG Resources (EOG:xnys), a major US shale producer, stated in its quarterly report that US production will fall faster than the government currently expects.
The market also found support from supply concerns related to reduced shipments from Libya due to a deteriorating security situation and Iraq where bad weather added to an already growing export bottleneck in the south.
WTI crude oil has settled into a range with support being provided by the 21-day moving average. During the sell-off from last summer this moving average provided resistance on several occasions and so far this month it has given support on three occasions. Resistance can be found at $55/b with a break above clearing the way for a potential, but unlikely, test back towards $60/b.
![Figure 04: WTI crude oil [Source Saxo Bank] Figure 04: WTI crude oil [Source Saxo Bank]](/fileadmin/_processed_/6/7/csm_04_SAXO_Hansen_20150223_b3b0813574.png)
Figure 04: WTI crude oil [Source Saxo Bank]
Gold traders looking for support following the slump
Gold reached, but initially found support, at $1,200/oz thereby almost erasing most of the gains seen this year. Platinum and silver fared even worse with the platinum:gold ratio falling to a two-year low while silver ended up being one of the worst performing commodities, albeit from a higher peak than gold.
Rising US government bond yields have during the past month been one of the major negative drivers and the outlook for rising US interest rates continue to be a cause for concern for the bulls.
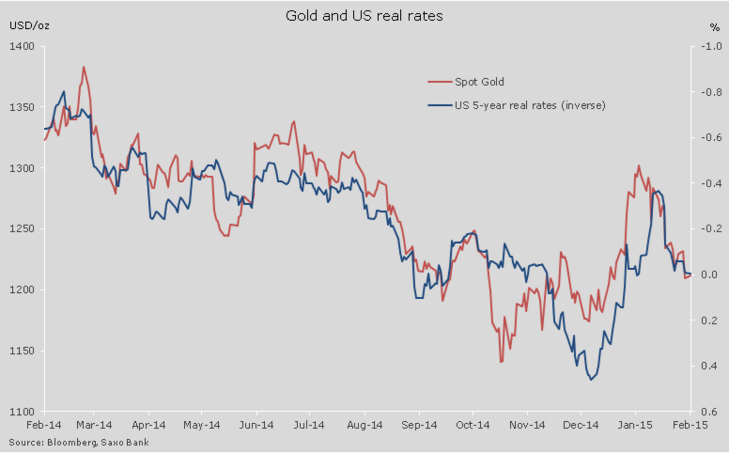
Figure 05: Gold and US real rates
The publication of a less hawkish set of minutes from the January FOMC meeting, together with the ongoing concerns about a potential exit of Greece from the euro, failed to give gold a lift big enough to push it back into relative safe territory above $1,220/oz.
Selling pressures have come from tactical traders such as hedge funds who rushed into gold following the move to unpeg the Swiss franc from the euro last month. Greek worries and signs that a rising dollar and global developments may trigger a delay in the beginning of rate normalization in the US should still lend enough support to establish a near-term base just below $1200/oz.
Once established the most likely outcome will be a period of rangebound trading where resistance will be determined by the 200-day moving average, currently at $1,248/oz.
![Figure 06: Gold chart [Source Saxo Bank] Figure 06: Gold chart [Source Saxo Bank]](/fileadmin/_processed_/0/f/csm_06_SAXO_Hansen_20150223_a3f8329fd5.png)
Figure 06: Gold chart [Source Saxo Bank]
Author:
Ole Hansen, Head of Commodity Strategy, Saxo Bank. Ole Sloth Hansen is a specialist in all traded Futures, with over 20 years’ experience both on the buy and sell side. Hansen joined Saxo Bank in 2008 and is today Head of Commodity Strategy focusing on a diversified range of products from fixed income to commodities. He previously worked for 15 years in London, most recently for a multi-asset Futures and Forex Hedge fund, where he was in charge of the trade execution team. He is available for comments on most commodities, especially energies and precious metals.

