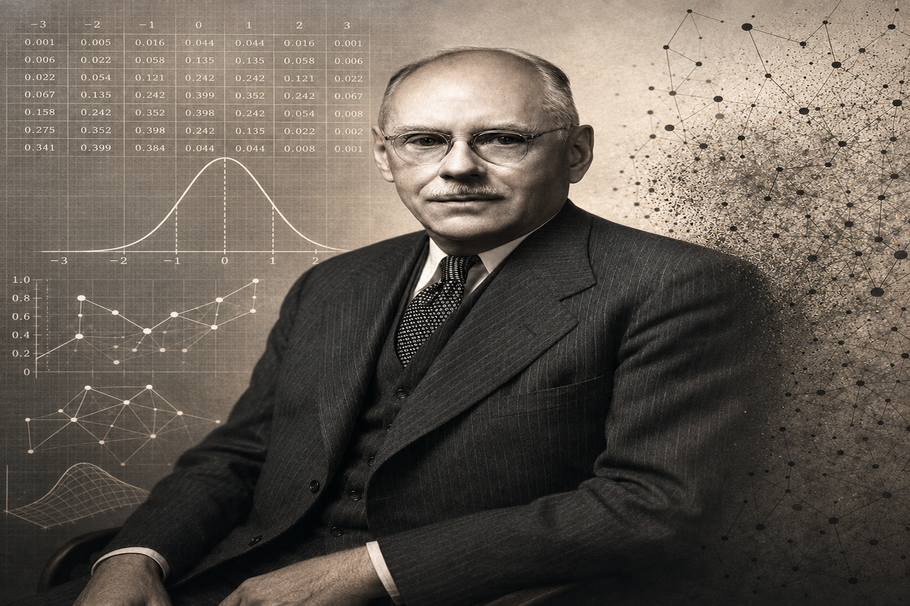

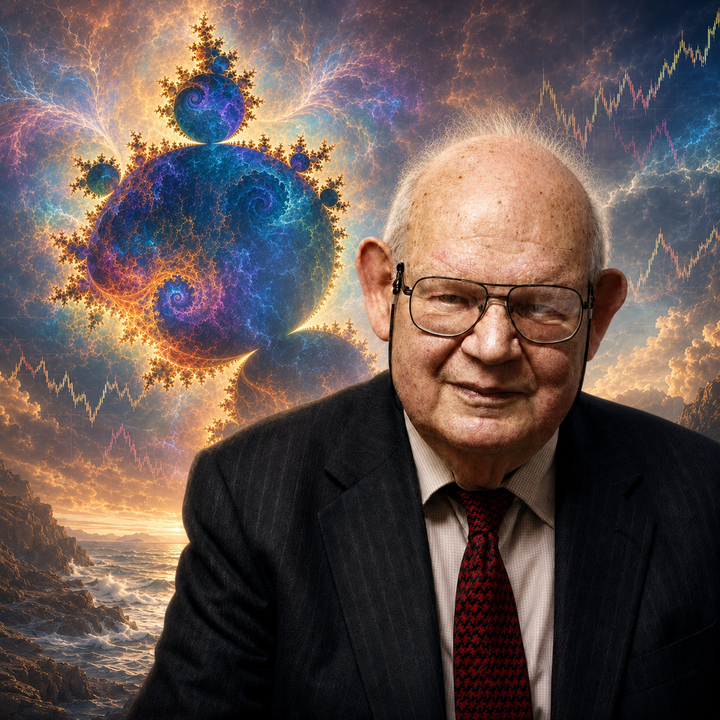
There are those rare moments when a researcher looks at a screen and suddenly realizes that a new order lies hidden behind the apparent chaos of the world. For Benoît B. Mandelbrot, such a moment was an epistemological revelation. In the 1970s, at IBM’s Thomas J. Watson Research Center in Yorktown Heights, north of New York City, he had the shapes—which would later become famous as the Mandelbrot set—calculated point by point. What appeared on the monitor was neither classical geometry nor a mere mathematical gimmick. It was a universe of forms that, with every magnification, revealed new branching patterns, repetitions, and irregularities. The deeper he zoomed in, the clearer it became: The world is not smooth. Not coastlines, not clouds, not tree bark—and not even the financial markets. Mandelbrot thus made visible something that extends far beyond mathematics. He showed that it is precisely the seemingly disorderly, jagged, and wild phenomena that operate according to their own rules. And anyone who ignores these rules systematically underestimates a risk.
Early Years: Exile, Geometry, Intuition
Benoît B. Mandelbrot was born in Warsaw in 1924 into a Lithuanian-Jewish family with an academic tradition. His mother was a doctor; his father, a clothing merchant. From an early age, he was introduced to mathematics by his uncles, including Szolem Mandelbrojt, who would later teach at the Collège de France. This family environment instilled in him not only an interest in mathematics but also an unusual freedom of thought. From an early age, mathematics did not strike him as a rigid system of rules, but rather as a kind of mental landscape that could be explored visually.
In 1936, the family moved to Paris to escape the growing threat posed by the Nazis. The experience of war and flight had a profound impact on Mandelbrot. In a later retrospective, he explicitly linked his mathematical talent to his observations of plants and trees during his flight. This is more than just a biographical anecdote. It points to his unique perspective: Mandelbrot rarely thought of mathematics in purely formal terms as equations, but almost always in a concrete, spatial, and geometric way. He did not first look for an existing method of calculation, but rather for the shape of a problem.
Even as a schoolboy, this talent made him famous. In a national exam, he was the only candidate in France to solve a difficult arithmetic problem—not by calculating the complicated integral in the first place, but by recognizing that a circular shape was hidden behind the problem. He transformed the coordinates and thus solved the problem using a geometric approach. This already foreshadowed the Mandelbrot of later years: less a follower of rules than a "pattern recognizer," less a collector of formulas than a "structure seer."
This unconventional approach remained characteristic of his entire body of work. Mandelbrot did not approach many mathematical questions from the perspective of proof techniques or a given formalism, but rather from images, shapes, and graphical concepts. Later, he explicitly contrasted this approach with the smoothed-out, strongly Platonic ideal of traditional geometry. It was not the perfectly abstract, but rather the visible, the rough, and the irregular that fascinated him. That is precisely why he was able to recognize scientific patterns where others saw only disorder.
IBM as a Laboratory for Wild Ideas
After a year at the University of Lille, Mandelbrot’s path eventually led him to the United States. In 1958, he joined the research department at IBM’s Thomas J. Watson Research Center. For many classical mathematicians, a career at a major corporation might have been a step down. For Mandelbrot, IBM was the opposite: a sanctuary of intellectual freedom. Here he could experiment with data, graphics, computing power, and interdisciplinary approaches without having to submit entirely to the conventions of an academic department.
In 1974, he was named an IBM Fellow—a distinction that afforded him an unusually high degree of freedom in his research. Mandelbrot himself later described these years as a golden era. At IBM in particular, he was able to link topics that often remained separate in traditional disciplines: language statistics, turbulence, coastlines, noise, price movements, and fractal geometry.
He was not understood everywhere. In the world of mathematics, Mandelbrot was long regarded as an eccentric, a maverick, a contrarian. He was not indifferent to formal proofs, but for him they were not the starting point of understanding. He wanted first to observe, compare, recognize patterns, and describe phenomena. This approach made him attuned to real, turbulent, disorderly worlds—and at the same time made him a figure of suspicion in parts of traditional mathematics.
Fractal Geometry: Clouds Are Not Spheres
Mandelbrot’s perhaps most famous statement is: Clouds are not spheres, mountains are not cones, coastlines are not circles, and lightning does not travel in a straight line. With this statement, he launched a direct attack on classical geometry—not because it is wrong, but because it is too neat, too smooth, and too idealized for many real-world forms. Nature does not produce Euclidean textbook figures. It produces roughness, branching, self-similarity, discontinuities, and scale dependence.
With fractal geometry, Mandelbrot created a language for precisely this roughness. Fractals are shapes whose structure repeats itself across different scales or at least exhibits similar patterns. As you zoom in, new branches emerge that remain related to the whole. It was precisely this self-similarity that made fractals so fascinating—both aesthetically and scientifically.
The Mandelbrot set, named after him, became an iconic symbol of this phenomenon. It demonstrated that a comparatively simple recursive rule can lead to a wealth of forms reminiscent of organic, natural, or turbulent structures. Mandelbrot was thus not merely the discoverer of a beautiful mathematical figure. He showed that behind the apparent disorder of complex structures, a precise, repeatable logic can lie hidden.
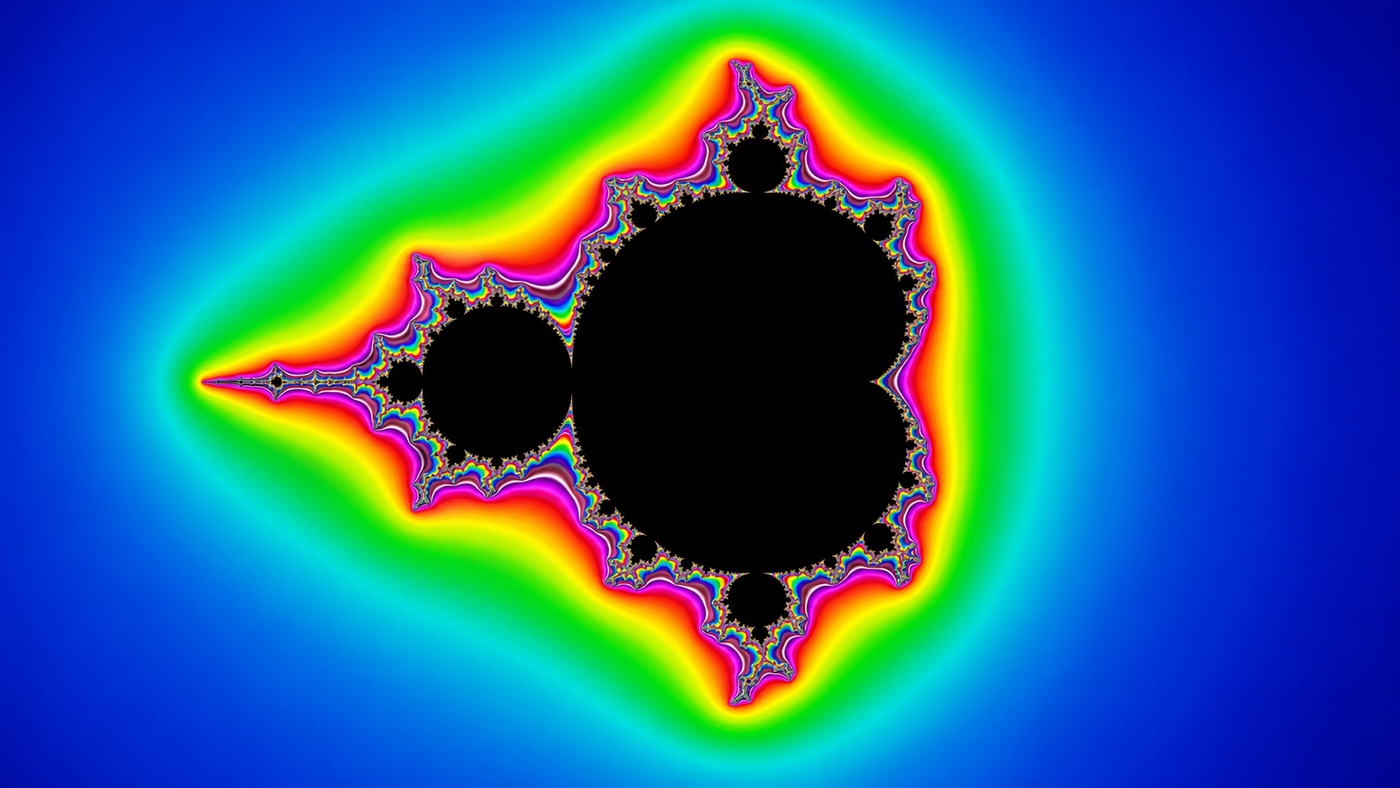 Fig. 01: Mandelbrot set: The black area marks the points of the Mandelbrot set; the colored surrounding region visualizes the complex boundary structure and reveals the fine self-similarity of the fractal
For science, this represented a shift in perspective. Roughness was no longer merely disruptive noise, but itself the subject of quantitative description. With the fractal dimension, Mandelbrot introduced a coefficient that, for the first time, allowed complexity and roughness to be systematically quantified. This made fractals a tool with applications far beyond mathematics—from geosciences and image processing to seismology and risk analysis.
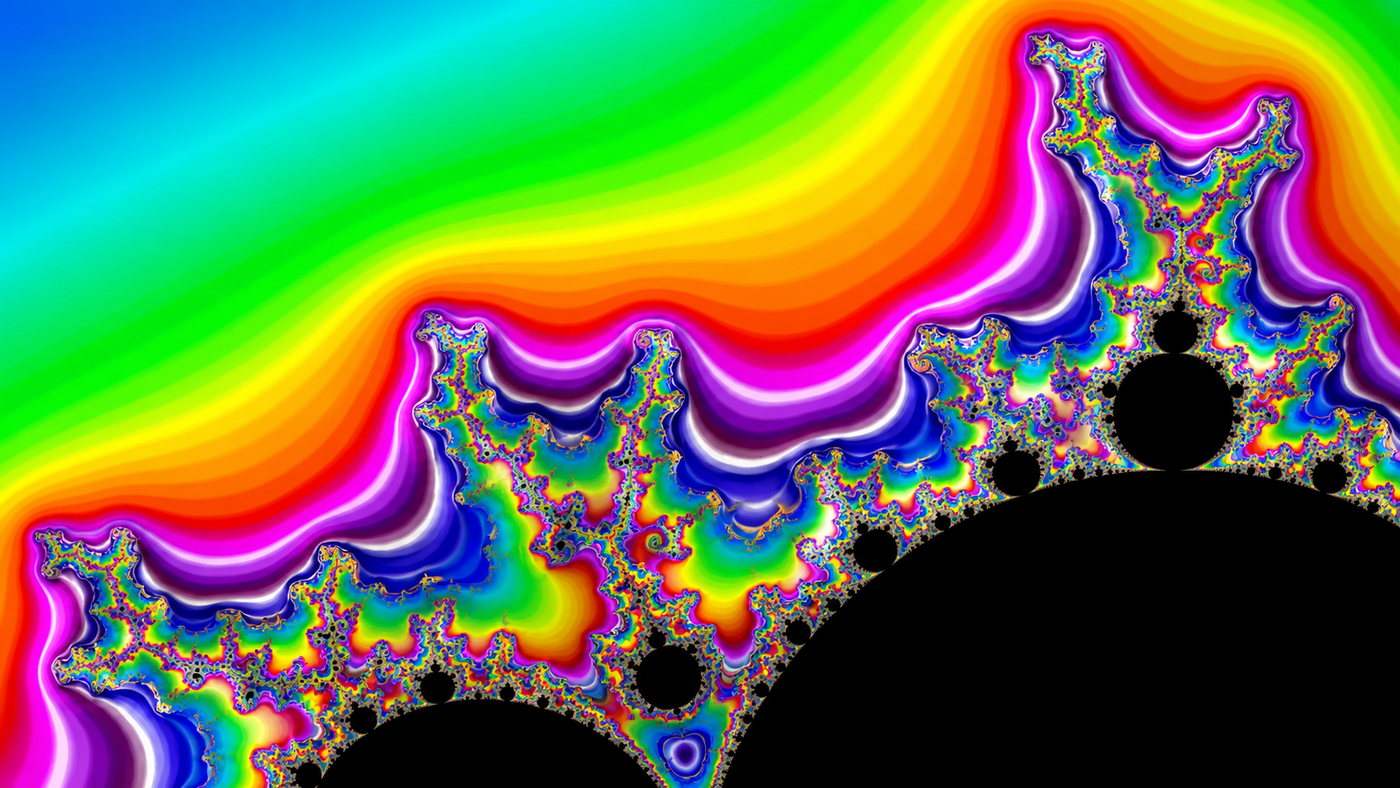 Fig. 02: Close-up of the boundary structure of the Mandelbrot set. The enlarged section shows the fractal fine structure of the boundary with its nested, self-similar shapes and illustrates the virtually unlimited complexity of the Mandelbrot set
Cotton Prices and the Discovery of Fat Tails
Perhaps even more significant for risk management than fractals was Mandelbrot’s work on financial market data. He examined historical cotton prices and encountered a problem that classical financial theory tended to ignore: the fluctuations were too erratic, too irregular, and above all too extreme to be reasonably described by a harmless Gaussian bell curve.
Mandelbrot argued that price fluctuations in the markets are not best captured by a normal distribution, but rather by stable Lévy distributions. This was no random theoretical choice: after the war, Mandelbrot had studied under Paul Lévy, among others—one of the great French probability theorists whose work on stable distributions and stochastic processes had clearly influenced him. In a sense, Mandelbrot thus applied a probabilistic perspective shaped by Lévy to a field that, at the time, hardly anyone had seriously attempted to model mathematically: the financial markets. For cotton prices dating back to 1816, he found a stability parameter of approximately α = 1.7—whereas α = 2 would correspond to the Gaussian case. The significance of this observation is profound: when α is less than 2, distributions with significantly heavier tails emerge—later popularly referred to as "fat tails." Extreme fluctuations are then no longer nearly impossible anomalies, but structurally much more likely than the normal distribution suggests.
In doing so, Mandelbrot fundamentally shifted the discussion of risk. In the Gaussian world, extreme losses are outliers, marginal phenomena, statistical accidents. In Mandelbrot’s world, they are not a disruption of the model, but part of its internal logic. Markets are not just volatile; they are rough. They do not move in small, gentle waves around a mean, but in jumps, clusters, and fractal patterns, in which large swings occur much more frequently than classical models would allow.
The world is not normally distributed
The world is not normally distributed—at least not where extreme events, nonlinearity, and scale dependence shape what happens. Mandelbrot criticized the widespread preference for the normal distribution as a dangerous intellectual convenience. It is elegant, manageable, and ubiquitous in many textbooks, but precisely for that reason, it is also seductive. Those who apply it uncritically to real markets create a deceptive sense of security.
Mandelbrot compared financial market participants to sailors [see Romeike 2015]: Someone who builds a ship is not concerned with exactly when the next storm will hit; they build it to withstand every conceivable storm. The financial world, on the other hand, according to Mandelbrot, often behaves as if there were only sunny days. Models with confidence levels of 99 or 99.5 percent exclude precisely those extreme events that would sink the ship in a real crisis.
Mandelbrot mocked the self-assurance of such models. His criticism was particularly harsh toward the widely used risk measure "Value at Risk" (VaR). When virtually all valuations are based on the assumption of normally distributed price movements, risk is systematically underestimated—that is exactly how he put it years before the global financial crisis. His famous dictum—that the stock market crash of October 19, 1987, should never have happened according to the logic of normal distribution—targeted precisely this blind spot. A theory that can treat such events only as nearly impossible accidents has failed to understand the phenomenon of market volatility.
Fractals and Finance: Markets Between Risk, Return, and Ruin
The power of Mandelbrot’s thinking is particularly evident in the financial markets. From his perspective, markets are not smooth machines that produce small random fluctuations around fair values. Rather, they are systems characterized by jumps, clusters, waves of sentiment, feedback loops, and extreme sensitivity to rare shocks. In such systems, risk, return, and ruin are much closer together than classical theory is willing to admit.
In a financial context, fractal thinking means two things above all. First: Extreme events do not belong on the periphery of analysis, but at its very center. Second: Patterns on small time scales and large time scales can be structurally similar. What appears to be mere noise at the intraday level often reappears in a transformed form on a monthly or annual basis. The markets thus possess a rough temporal structure that cannot be elegantly translated into the language of innocuous averages.
Mandelbrot therefore never viewed returns in isolation from the risk of ruin. Those who look only at mean values and standard deviations see, at best, the well-tempered surface of market activity. The real drama unfolds at the edges of the distributions: during liquidity crises, cascade effects, abrupt trend reversals, and on those days when seemingly impossible losses suddenly occur. Unfortunately, some risk management standards—and even practitioners in the corporate world—have still not grasped this fact to this day.
The fractal perspective therefore compels risk management to adopt an uncomfortable honesty. It does not ask first: "How high is the average loss?" But rather: "What kind of world are we dealing with in the first place? Is it smooth enough for a normal distribution—or rough enough that extreme events occur structurally more frequently?" Only this question reveals which measures, models, and safeguards make sense at all.
In this sense, Mandelbrot links risk, return, and ruin not morally, but geometrically. Markets are forms of uncertainty. And like any rough form, they require a set of tools that takes their ramifications seriously.
Mandelbrot in Today’s Risk Management
For today’s risk management, Mandelbrot is both a source of inspiration and a thorn in the side. His insights compel us to examine model assumptions ontologically: What kind of world are we actually assuming? A world of small, additive, benign fluctuations? Or a world with clusters, jumps, instabilities, and "heavy tails" (see, for example, the recent geopolitical turbulence)?
This is precisely why Mandelbrot is equally relevant to banks, insurers, asset managers, industrial companies, ministries, government agencies, and regulatory authorities. Stress tests, scenario analyses, expected shortfall, extreme value theory, tail dependence concepts, resilience considerations, and robust risk-bearing capacity models all draw—directly or indirectly—on the same fundamental intuition: The tails of a distribution are more important than classical models have long acknowledged.
Mandelbrot thus also teaches methodological humility. Not every risk can be exhaustively captured by a smooth, elegant model. Precisely where data is erratic, dependencies are unstable, and systems are highly interconnected, risk management must accept that extreme events are not mere disruptions, but rather an expression of the system’s structure.
Criticism, Limitations, and Further Developments
As convincing as Mandelbrot’s critique of the normal distribution was, his approach was not without its objections. Pure stable Lévy distributions with infinite variance are indeed a powerful warning signal, but they are not always directly applicable in practice. Many practitioners seek models that, on the one hand, allow for "fat tails" but, on the other hand, remain statistically and numerically easier to handle.
This has led to numerous further developments: truncated or tempered stable distributions, GARCH models, multifractal approaches, regime-switching-based methods, and other forms of non-Gaussian dynamics. These models extend far beyond Mandelbrot, yet they almost always stem from the same productive dissatisfaction that drove him: the realization that the smooth Gaussian world remains an all-too-harmless fiction for many real markets.
This is precisely why Mandelbrot remains relevant today. Not because every one of his model ideas has been adopted unchanged, but because he identified the fundamental problem more precisely than many others. He showed where the convenient paradigm breaks down—and thus, which questions future models must answer.
Conclusion and Outlook
Benoît B. Mandelbrot was at once a mathematician, an aesthete of the rough, and a theorist of risk. He saw order where others saw only turmoil, and danger where others suspected only statistical background noise. His fractal geometry made nature readable in a new way. His analysis of financial markets revealed that extreme events are not anomalies, but building blocks of reality.
It is precisely in this that his enduring greatness lies. Mandelbrot reminds us that science does not consist of forcing the world into convenient models, but of taking its true structure seriously—even if it is rough, jagged, and difficult to handle. The perspective his work opens up is therefore challenging: better models, more robust institutions, more realistic stress tests, and a risk mindset that does not shy away from "fat tails" but places them at the center.
One could say: Mandelbrot did not teach the financial world how to predict the next storm with precision. But he taught us that we should stop building ships designed only for sunny days.
Bibliography and Further Reading:
- Mandelbrot, Benoît B. (1963): The Variation of Certain Speculative Prices. In: The Journal of Business, Vol. 36, No. 4, pp. 394–419.
- Mandelbrot, Benoît B. (1982): The Fractal Geometry of Nature, W. H. Freeman, New York 1982.
- Mandelbrot, Benoît B. (1997): Fractals and Scaling in Finance: Discontinuity, Concentration, Risk, Springer, New York 1997.
- Mandelbrot, Benoît B. (2012): The Fractalist. Memoir of a Scientific Maverick, Pantheon Books, New York 2012.
- Mandelbrot, Benoît B. / Hudson, Richard L. (2004): The (Mis)Behavior of Markets: A Fractal View of Risk, Ruin, and Reward, Basic Books, New York 2004.
- Romeike, Frank (2015): Beautiful, Colorful Risk: Benoît B. Mandelbrot—Remembering the Father of Fractals. In: The European, Issue 2/2015, pp. 196–207.